The expression "b = 1 to 5.5; stepsize = 0.5" in the
Work window represents an iterated constant. This particular expression represents the set of
constants {1, 1.5, 2, 2.5, 3, 3.5, 4, 4.5, 5, 5.5}. When you plot a function expression
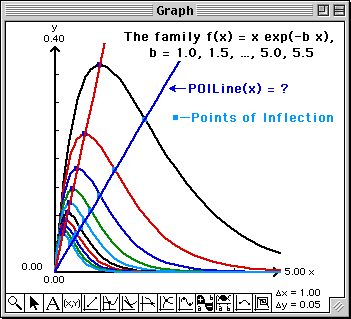
containing an iterated constant, for example, f(x) = x exp(-b x), a curve will be plotted
for each value of the iterated constant.
- Plot f(x) = x exp(-b x) on 0
 x
x 5 and
0
 y
y 0.4.
0.4.
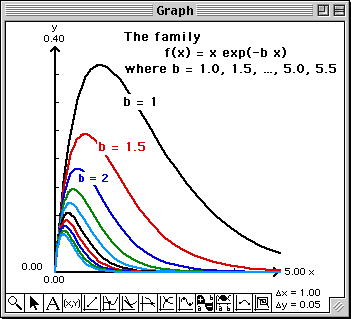
The data table Maximums[10,2] in the Work window contains the coordinates of the maximum
values of the family of curves.
- Select the data table Maximums[10,2] in the Work window.
- Select Overlay Plot from the Graph menu.
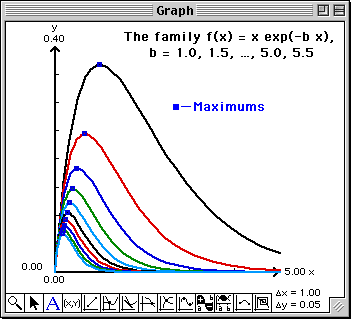
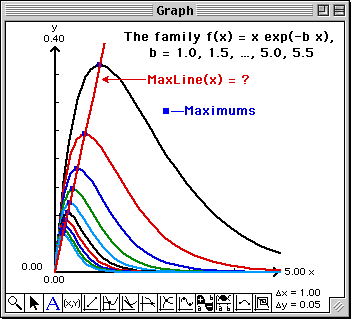
Does it appear that the points located at the maximum values all lie on a straight line?
Can you find the equation of this straight line?
The data table PointsOfInflection[10,2] in the Work window contains the coordinates
of the points of inflection of the family of curves.
- Select the data table PointsOfInflection[10,2] in the
Work window.
- Select Overlay Plot from the Graph menu.
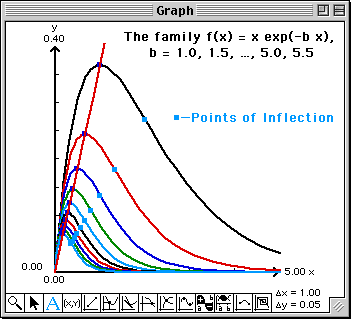
Does it appear that the points of inflection all lie on a straight line?
Can you find the equation of this straight line?
Copyright 2000-2008 Adam O. Hausknecht and Robert E. Kowalczyk


